What we can learn from UX Research job descriptions
Building a data-driven UX research career ladder: Part I
What’s the difference between a lead and a senior-level UX researcher? Can you concretely summarize the differences in their qualifications (e.g., how many more years of experience does a Lead have?) and daily tasks (e.g., what are the specific differences in their responsibilities and how they spend their time)? You’re not alone if you find this question difficult to answer. Understanding differences across all levels of seniority is a pain point for many in the field.
Many job-seekers struggle to gauge their qualifications, wondering whether they are a good fit for senior-level roles or if they should be applying for mid-level roles. Leaders often need help formalizing their team’s seniority levels and creating personal development goals suitable for researchers at each level. These and additional pain points could be addressed if we had access to a data-driven, company-agnostic career ladder with benchmarked requirements, qualifications, and responsibilities at each level of the career path.
In this series of three articles, we will detail our approach toward creating a data-driven UX research career ladder. In this first article, we’ll provide an overview of how we collected and analyzed ~1,400 user research job descriptions and what we learned through the metadata in the job postings. In parts two and three, we’ll review detailed findings for qualifications and responsibilities across levels of seniority.
Collecting and analyzing ~1,400 UX Research job descriptions
This project isn’t the first effort to describe the role of a UX researcher. Others like those by Varnagy-Toth and Utesch & Nguyen have used small-scale analysis of job descriptions to describe in-demand qualifications and skills for UX researchers. A few have articulated how some skills might differ as a researcher advances in their career, such as Hora using patterns observed from his professional experience and the ResearchOps Community using a series of workshops. But, none of these previous projects created a data-driven career ladder — something that defines the specific qualifications and responsibilities at progressively higher levels of seniority.
This project leveraged publicly available data from job postings to create a dataset of UX research positions coded by seniority, qualifications, and responsibilities. Job postings were chosen as a promising source of data because they have five essential characteristics:
They’re publicly available.
They almost always include seniority level.
They include skills, qualifications, and responsibilities required for that level of seniority. Additionally, they have valuable metadata like salary, locations, and employment type that can inform our understanding of the job market.
There are thousands of them, which gives us enough of a sample for several observations across all levels of seniority.
Finally, they provide a continually updated data source, enabling longitudinal analyses.
Manually reviewing individual job descriptions online would be time-consuming, tedious, and prone to error, so we developed an approach leveraging an API to collect publicly available US-based UX research job descriptions throughout late 2023 and early 2024. Job descriptions are notoriously inconsistently formatted, so we used Python for data cleaning and thematic coding. We borrowed and expanded upon codes used in the previous efforts mentioned above (i.e., Varnagy-Toth, Utesch & Nguyen) to identify a set of 350+ different variables that recorded everything from seniority-level of the role, company, location, type (e.g., full-time, contract, etc.), salary, qualifications (e.g., degree requirements, years of experience, etc.), and responsibilities.
In short, we used APIs, Python, and Excel to collect and clean 1,394 UX research job descriptions and coded them by seniority, qualifications, and responsibilities. This process produced a dataset we analyzed and summarized into a data-driven career ladder.
What we can learn from UX research job description metadata
We’ve synthesized all of our analysis into the career ladder below. In the columns, roles increase in seniority for individual contributors (ICs), from interns to very senior roles like Principals and Staff Researchers, and people leadership positions, like Managers and Directors.
In this series of articles, we’ll discuss in detail each specific analysis that went into producing the summary you see in the rows. Later articles will focus on qualifications and responsibilities. In this article, we'll discuss compensation and four other trends we identified by inspecting metadata from the job postings.

UX Researcher is the most common title
UX Researchers go by many different titles. Our method searched the web for titles including “Product Researcher”, “User Researcher”, “User Experience Researcher”, “UX Researcher”, and “Design Researcher”. Naturally, we were curious about which titles appeared most often.
The bar graph below shows the percentage of each title in our dataset. “UX…” and “User Experience Researcher” took up the top two spots with 58% and 13% of the sample, respectively. No other researcher title made up more than 10% of the sample. You can see titles like “Product…” or “Design Researcher” are present in the sample but weren’t nearly as common as “UX” or “User Experience”.
In the future, we may consider differences in the roles and responsibilities of these titles, but for this analysis, all titles were merged by seniority level. For example, regardless of title, all “senior” level positions were grouped together.
Most job postings are for mid- and senior-level positions
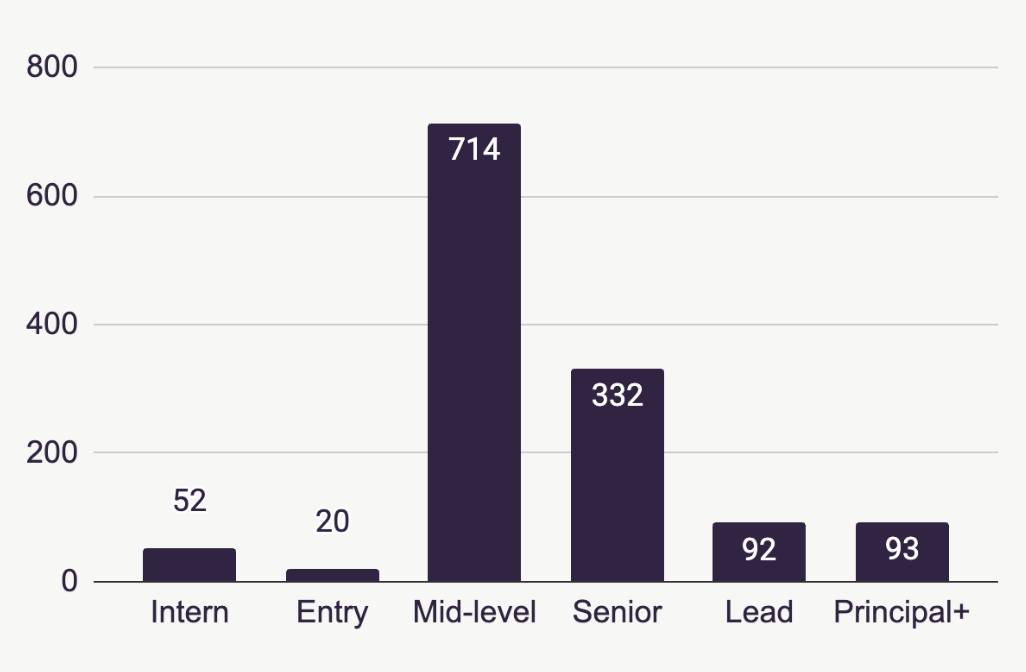
Our sample captured a variety of roles and seniority levels. The IC roles in the graph below progressed in seniority from Intern -> Entry -> Mid -> Senior -> Lead -> Principal+. This final group, “Principal+”, includes a variety of very high-level IC roles like Principal, Staff, and Senior Staff. These were grouped together in analysis because the sample size for each role (e.g., “Staff’) was relatively small, and the use and relative ranking (e.g., whether “Staff” or “Principal” is more senior) tends to vary from one organization to another.
Entry-level UX research roles are relatively difficult to come by, making up a tiny fraction of the sample. “Mid-level” roles are by far the most prevalent IC level, making up over 50% of our observations. “Senior” level roles were also relatively common, but higher seniority roles like Lead or Principal were fairly uncommon. These data suggest that job-seekers in the middle stages of their careers will have the most options.
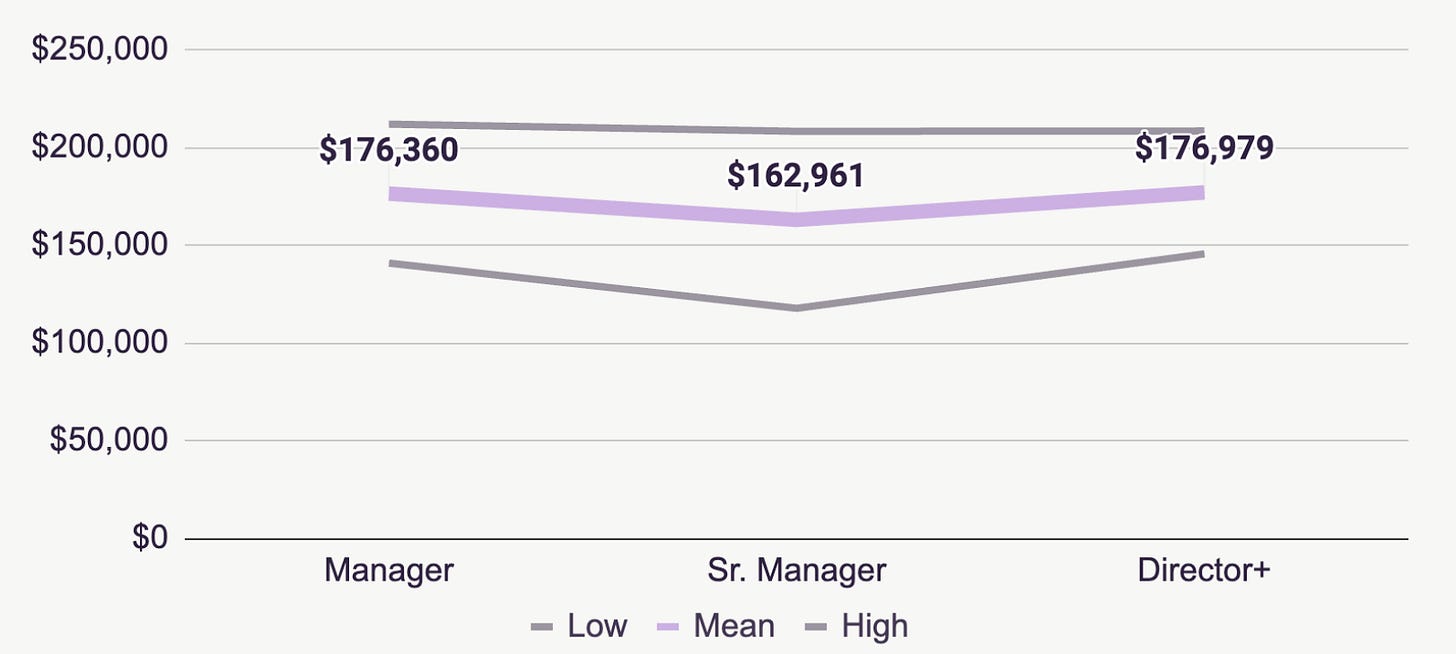
On the management side, there were significantly fewer roles in our sample. We grouped these roles into Managers, Senior Managers, and Director+. The latter group included titles such as Director, Senior Director, VP, and Head.
An interesting note on the relative scarcity of these roles is that, though they are generally less common (i.e., you would expect fewer “Managers” than “Seniors” on a team), these numbers may be artificially low. Based on some of our secondary research, many senior leadership positions are never publicly posted; instead filled by an executive recruiter who searches for candidates. Despite these relatively low sample sizes, it was still enough to determine broad differences between individual-contributor and people-leadership positions on variables like salaries, qualifications, and responsibilities.
Salaries rise with seniority but stall in management
Fortunately, we obtained salary information for many of the job postings in our sample. Salaries are often presented as a range including high and low values. The graph below summarizes the salary data from IC roles, where the grey and purple lines represent the typical end-points and center of the salary range, respectively. As we can see, the typical compensation for IC researchers steadily increases with seniority level.
The data for management positions tells a different story. In the graph below, management positions share a similarly high salary range, but there wasn’t an apparent increase with progressively higher titles. There could be many reasons for this result, including a limited sample, differences in salary between management positions that are posted publicly vs. those delegated to executive recruiters, or even differences in compensation structure (like incentive and performance bonuses) that aren’t reflected in the salary itself. Regardless, these data suggest that moving into a management position doesn’t necessarily come with a pay raise, so keep that in mind when plotting your career journey.
Full-time opportunities prevail, but contract roles climb at mid-level
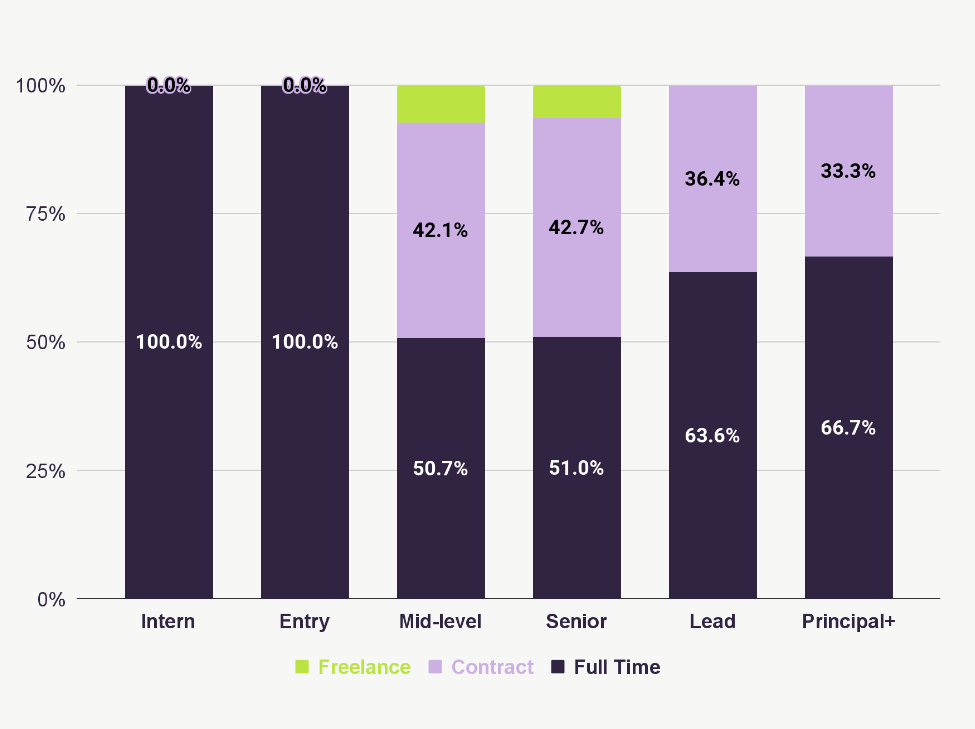
Employment type, whether full-time (FTE) or contract-based, is a crucial consideration for most job seekers. We’ve received many questions about the relative frequency of FTE vs. contract positions, so let’s dive into the data. In the stacked bar graph below, you can see the relative frequency of FTE, contract, and freelance positions by seniority level.
Our data show that most positions were full-time openings — which is good news for the many job-seekers who prefer this arrangement. However, we do see that over 40% of the most common categories, mid- and senior-level job openings, are contract positions. For people leadership roles (below), we saw relatively few contract positions.
We’ve spoken with several people impacted by layoffs over the past few years, and many are willing to take a contract role to bridge the gap to the next full-time position. But these data suggest that this approach is most tenable for researchers in the mid to senior era of their careers.
Half of open roles are remote
In the past five years, the landscape of work has changed significantly. Global events in 2020 forced most office employees to work from home; in turn, most UX research went remote. By one estimate, over 90% of researchers were working remotely. Since then, many roles have been returning to in-office or hybrid settings. In our dataset, 49.9% of roles were designated as remote.
We’ve plotted the in-person roles that listed a physical location on the map below. Roles were widely distributed across states, with concentrations in locations one might suspect, like Seattle and Silicon Valley, which have long been tech hubs. We also saw some intriguing hotspots in Texas, Missouri, Illinois, and New York City. It’s important to remember that this data is a snapshot in time, indicative of hiring in late 2023 and early 2024, and may reflect geographical regions where in-person work is more common.
The bottom line
We set out to create a data-driven career ladder to help UX researchers navigate their careers with confidence and clarity. To do so, we devised an approach to collect almost 1,400 UX research job descriptions and code them by seniority, qualifications, and responsibilities. We’ve analyzed over 350 variables, summarizing them into a single career ladder table.
In this article, we reviewed metadata pulled from the job postings and found that:
Researchers go by many names (e.g., “Product” or “Design Researchers”), but “UX…” or “User Experience Researcher” is the most common.
The majority of job postings are for mid-level roles, whereas entry, high-level IC roles (like Principal), and management roles are relatively uncommon. Job seekers in the middle stages of their careers will have the most options.
Salaries rise with seniority, but taking a management position in UXR isn’t guaranteed to significantly increase your pay beyond what a high-level IC could make. Compensation shouldn’t be the only consideration in longer-term career planning.
Most job openings are full-time, but a decent proportion of mid and senior-level positions are contract-based. Professionals aspiring to mid and senior roles might need to consider contract work as a viable path more often than those at other stages of their careers.
At current, about half of job openings are remote. Though a decline from all-time highs, this shows there is still an opportunity for job candidates distributed across the country.
In subsequent articles, we’ll break down the data behind the next two rows in our career ladder. In Part 2, we’ll dive into the data on qualifications at each level of seniority, including years of experience and the degree levels and backgrounds that UX research positions ask for. Finally, in Part 3, we’ll review how responsibilities change throughout a UX researcher’s career and discuss what’s next for this project and related follow-ups.


This is very informative, thank you all! As a job seeker myself, when comparing my experiences between 2021 and 2024, I see quite an improvement in job descriptions. Generally speaking, recent JDs are more clear in what they're looking for.
I'm curious to see what the trend is in hiring qual or quant focus or mixed method researcher. Looking forward to reading part 2 and 3!